Any one of four periods can be selected. The first period covers 2008–2010. The reason for choosing this short period is that the current ISCO occupational classification (ISCO-08) was implemented in the EU-LFS starting in 2011, replacing the previous ISCO-88. As occupation (ISCO) is a key variable – along with sector (NACE) – in applying the EJM method and since there are no reasonable possibilities of a crosswalk between the old and new versions of the classification at the level of detail of our analysis (ISCO 2 digit), this necessitates treating the period separately. The reason that the period begins in 2008 is that a similar change of the sector (NACE) classification was implemented in the EU-LFS in 2008.
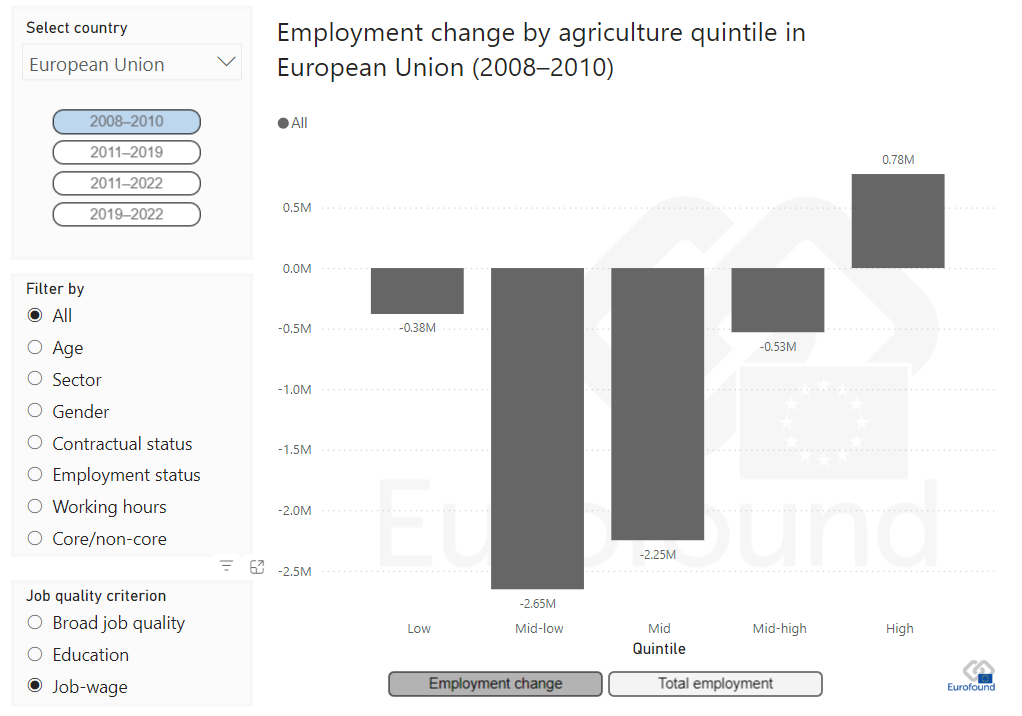
Coincidentally, 2008–2010 was the peak period of the global financial crisis so the quintile charts allow us to see how this period of employment contraction played out across the job–wage distribution in different Member States. As can be observed in Figure 1, for the EU27 as a whole the negative employment effects of the crisis were felt most sharply in the middle and mid–low part of the job–wage distribution where together nearly five million jobs were lost. Employment grew during 2008–2010 only in well-paid, top-quintile jobs.
Figure 1: Employment shifts in the EU27 during the global financial crisis
For the three other periods indicated – 2011–2019, 2019–2022 and 2011–2022 – the analysis is based on an assignment of jobs to quintiles in each country in the base year 2011. For this reason, the total employment tab shows equal employment by quintile in the start year 2011. In each of the subsequent years (2019, 2022), the total employment tab shows how overall employment by quintile grew or declined compared to 2011.
Job quintile charts can be generated for any of the EU27 Member States and for the EU27 as a whole. This latter chart effectively treats the EU27 as one large Member State. The EU job ranking is the employment weighted average of the individual standardised national job rankings.
In addition to selection by country, by ranking criterion and by period, users can also select the breakdowns for each quintile chart which decompose the aggregate employment levels/changes observed in each quintile by gender, age, broad sector etc. as listed below.
|
| Age | 15-29, 30-49, 50-64 | |
|---|
| Sector | Mainly public services, mainly private services, agriculture/extractive, construction, manufacturing/utilities | See listing below |
|---|
| Gender | Male, female | |
|---|
| Contractual status | Permanent, temporary | Employees only |
|---|
| Employment status | Employee, self-employed | Family workers excluded |
|---|
| Working hours | Part time, full time | Self-reported (LFS variable ftpt) |
|---|
| Core / non-core | Core, non-core | Core=full-time, permanent, dependent employee. Non-core=all remaining employment.
|
|---|
|
| A - Agriculture, forestry and fishing | Agriculture / extractive |
| B - Mining and quarrying | Agriculture / extractive |
| C - Manufacturing | Manufacturing / utilities |
| D - Electricity, gas, steam and air conditioning supply | Manufacturing / utilities |
| E - Water supply; sewerage, waste management and remediation | Manufacturing / utilities |
| F - Construction | Construction |
| G - Wholesale and retail trade etc. | Mainly private services |
| H - Transportation and storage | Mainly private services |
| I - Accommodation and food service activities | Mainly private services |
| J - Information and communication | Mainly private services |
| K - Financial and insurance activities | Mainly private services |
| L - Real estate activities | Mainly private services |
| M - Professional, scientific and technical activities | Mainly private services |
| N - Administrative and support service activities | Mainly private services |
| O - Public administration and defence; compulsory social security | Mainly public services |
| P - Education | Mainly public services |
| Q - Human health and social work activities | Mainly public services |
| R - Arts, entertainment and recreation | Mainly private services |
| S - Other service activities | Mainly private services |
| T - Activities of households as employers | Mainly private services |
| U - Activities of extraterritorial organizations and bodies | Mainly private services |